Classification of
Pharmacological Spectra
Spectral Map Analysis (SMA) originated in 1974 within the context of medicinal chemistry in the research laboratory of Dr. Paul Janssen in Beerse (Belgium).
The pharmacologists at Janssen in that period were engaged in extensive research on neuroleptic drugs that control the symptoms of severe psychosis (like so-called schizophrenia) among which hallucinations, stereotyped behavior, bizarre thoughts and extreme agitation.
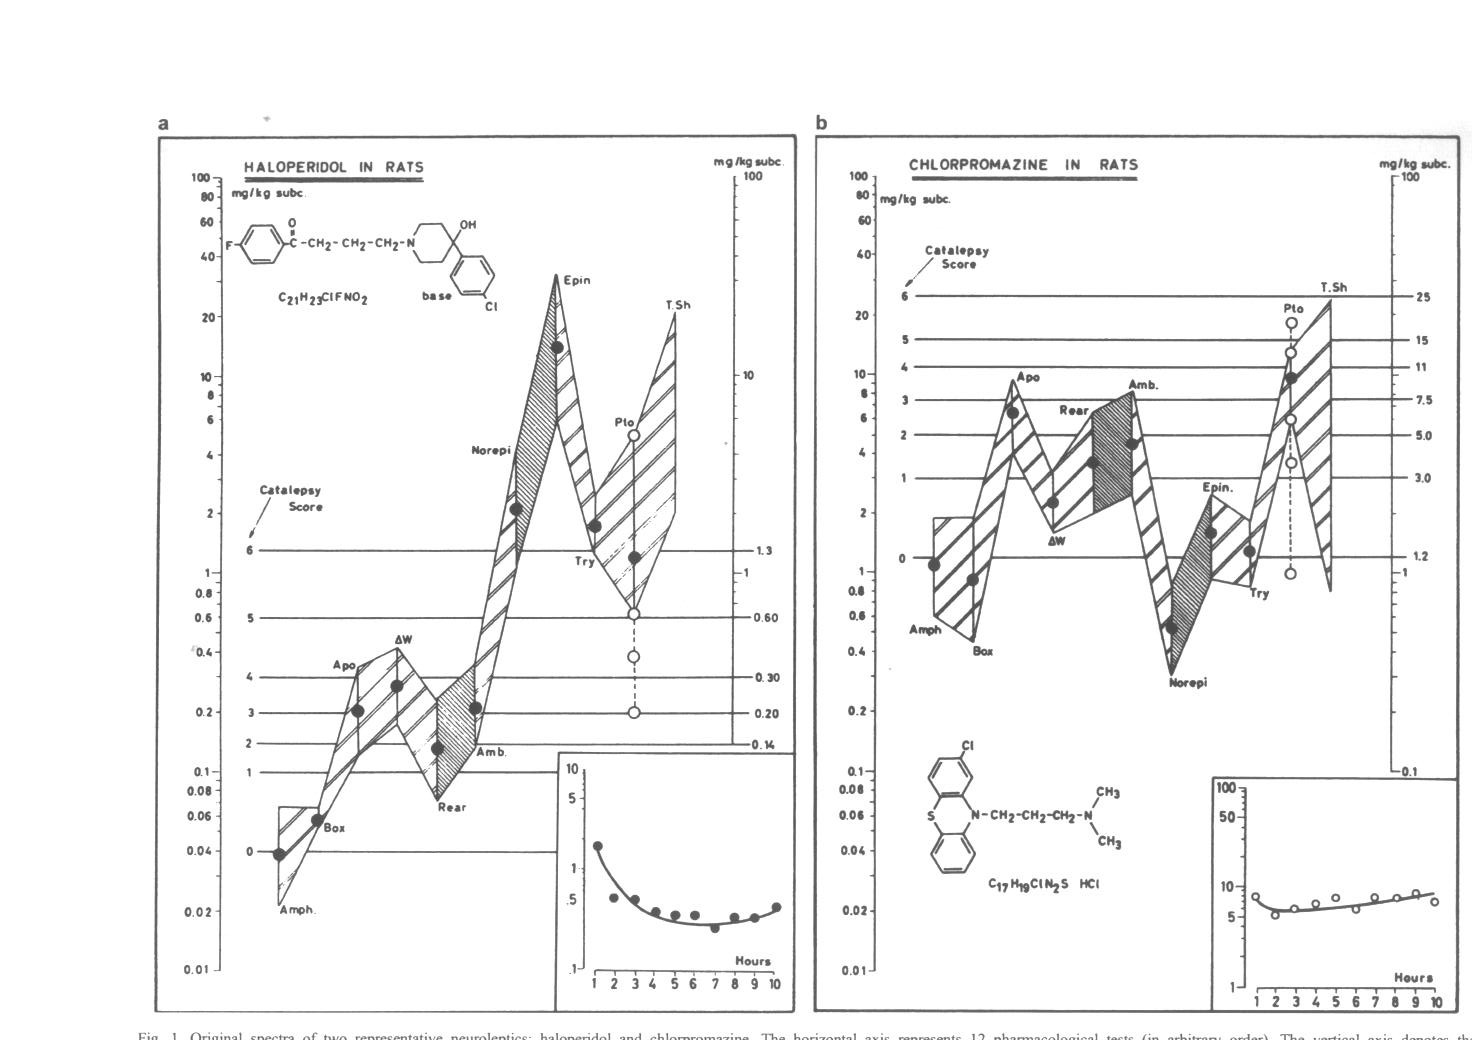
The pharmacological activities of 45 neuroleptic compounds had been obtained from 12 different behavioral tests on rats. The results of the tests are expressed as the logarithms of the median effective dose (ED50). The ED50 is defined as the dose which produces an effect in 50 percent of the animals on test. The observed effects of neuroleptics were, for example, inhibition of stereotyped behavior induced by amphetamine (which is chemically related to dopamine), inhibition of agitation produced by norepinephrine (adrenalin) or inhibition of the effects produced by tryptamine ( which is chemically related to serotonin).
The test battery also studied changes in body weight , closure of the eyelids (ptosis), abnormal postures (catalepsy), standing up on hind legs (rearing), running around (ambulation), jumping over a hurdle upon a signal, resistance to being spun around (shock).
It is now understood that dopamine, norepinephrine and serotonin are neurotransmitters (small messenger molecules) that are naturally produced inside the brain. Each of these neurotransmitters can bind to specific receptor proteins that are embedded in the membranes of neurons at their synapses (junctures). Binding of dopamine, norepinephrine and serotonin to their corresponding receptors can inhibit the transmission of neuronal signals. Severe psychiatric disorders are often attributed to an excess, shortage or imbalance between dopamine, norepinephrine and serotonin in the brain, but in 1974 this concept of the three neurotransmitters and their associated receptors was not as clearly understood as it is today.
Dr. Janssen had a habit of making diagrams by hand that showed the activities of a compound (on a logarithmic vertical axis) with respect to the 12 tests (represented in a fixed order along the horizontal axis). This produced a characteristic “spectrum” of the particular neuroleptic compound in the battery of 12 pharmacologic tests. The word spectrum was chosen by analogy with the spectra of compounds that are produced by ultraviolet, infrared and other types of spectrometry. The shape or profile of the spectra, and not their size or magnitude, allows an identification and differentiation of the compounds.
A selection of two from the 45 neuroleptic spectra is shown in the figure. Some spectra possess an ascending profile from left to right (such as haloperidol, represented on the left of the figure), while others have a rather flat one (such as chlorpromazine, represented on the right). The former are neuroleptics that are predominantly active in inhibiting the dopamine receptor, while the latter are predominantly potent in blocking the norepinephrine receptor. There are also compounds with mixed profiles, and these were more difficult to classify. What also confounds the classification is that some compounds, although having the same profiles (shape), are different because they appear at different elevations on the diagrams, in accordance with their differences in potency (size). It can be seen that the problem of classifying medicinal compounds from pharmacological tests is one of “size and shape”, such as was mentioned above in the classification of animals from morphometric measurements.
It appears that the one-dimensional classification of the neuroleptic compounds according to their specificity (or contrast) for either the dopamine or the norepinephrine receptors was inadequate.
Dr. Janssen ordered the draftsman to draw the neuroleptic spectra on little cards. These were spread out on a table in the lab, and the pharmacologists were asked to arrange the cards in order to obtain a more satisfactory classification in two dimensions. In view of the size and shape problem, it is not surprising that no general agreement could be obtained. Therefore, Dr. Janssen asked the author (P. J. Lewi) to devise a mathematical solution to the problem of classifying the neuroleptic compounds according to the tests performed on animals.